


While crafting solutions using code, there is a high chance that an error might find its way into the code, then the software begins to act in an unintended way.
When this happens, it is said that the code has a bug 🐛🐛🐛
A software bug is an error, flaw, or fault in a computer program or system that causes it to produce an incorrect or unexpected result, or to behave in unintended ways - source
When this happens, we are faced with discovering the source of the bug in our code, then resolving it. This process is known as debugging.
This post aims to explore the process involved when debugging for errors during the software development process. The app that is used in the demo is a ReactJs application, and the IDE(Integrated development environment) in the demo is Visual studio code.
Generally, I'd say the process of debugging consists of two main processes:
Discovering the bug and
Resolving the bug
But due to the method employed when trying to pinpoint the error location in the code, the first process may take a very long time, and it may result in this 👇🏽
Steps to debugging correctly
Discovering the bug - Read the Stack trace
In computing, a stack trace (also called stack backtrace or stack traceback) is a report of the active stack frames at a certain point in time during the execution of a program. -source
To show this, a simple bug has been introduced into the ReactJs demo app used, below is the stack trace.
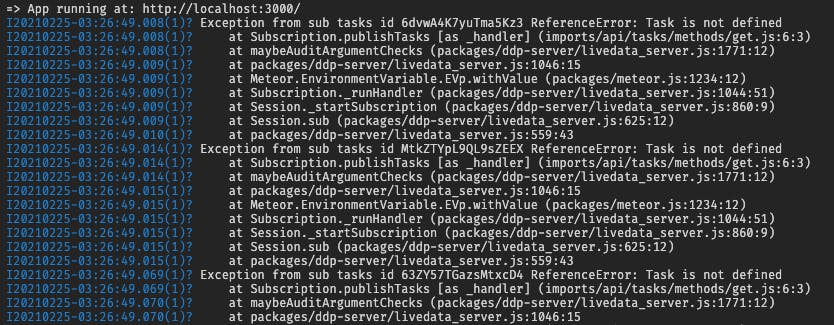
From the screenshot above, a series of error construct with different paths are displayed in the console. Looking at the trace, you'd see more file paths than you knew existed in your code; don't fret, these are the path to the modules you'd installed to make your project execute successfully. While you are reading the stack trace, keep in mind that you are to seek out the files you wrote, not the modules you installed.
And from this stack trace, we can see that the issue is a ReferenceError: Task is not defined in a file called get.js on line 6.
Bug found! 🐛
Now on to step 2.
Resolving the bug
Now that we've been able to pinpoint where the error is thrown, curiosity will set in. As far as we are concerned, the code was well written, so, it's just normal to go into the file and see things for ourselves.
Many developers at this point are probably getting their fingers ready to start the administering of the "almighty" console.log at various parts of the file in question, to fully understand the value of Task is at different points.
While that approach is totally acceptable and even seems most practical in this particular situation, in a scenario where you've got a more complex and elusive bug where you're pointed to many files. In that situation, you will have many console.log in your code, with some "cryptic" 😉 texts added to locate them on the console. This may not look good on you if you push some of them inadvertently to the production code.
In light of this, instead of using the logging methods to satisfy your curiosity, you can instead use the debugger.
This is a tool that is built-in with our IDE, and it supports Javascript, Typescript, and every other language and library that compiles down to JS out of the box. To use the debugger with other languages in VSCode, you have to install the plugins from the VSCode marketplace. You can read more about it here.
- using the debugger in VSCode
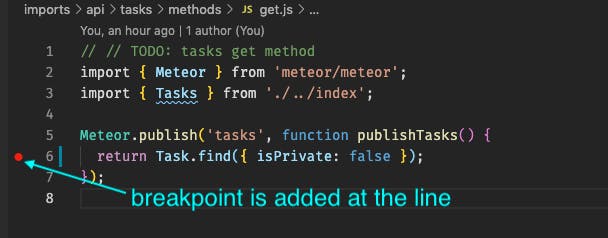
The first thing that is needed to be done is to add breakpoints before/at the line noted by the stack trace, to see how data is flowing up till that point, at the point, and after it, all with one breakpoint.
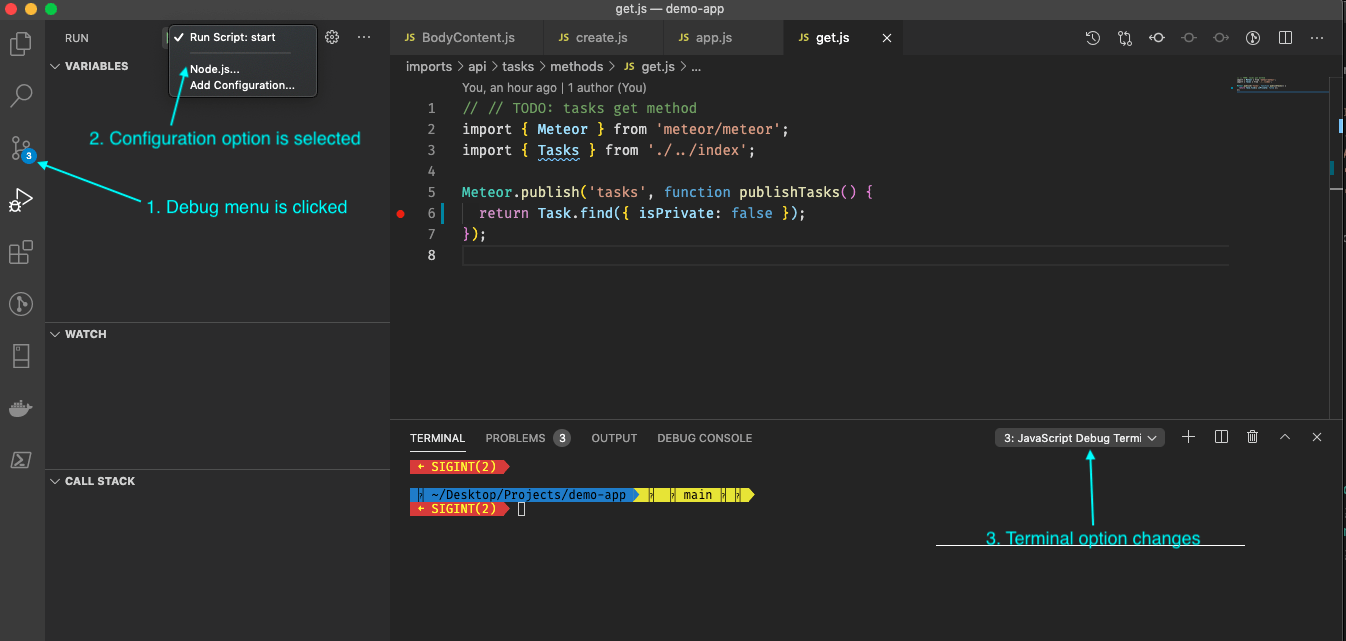
Then the debug button is clicked, which moves the IDE to the debug panel, the configuration (Nodejs) is selected, and the option for "Run Script: start" is available to be selected. This switches your VSCode terminal to the JavaScript Debug Terminal.
Upon running the start script, the app starts up in debug mode. The call stack, breakpoints, variable values, and the debug control button are visible on the screen, all geared towards helping the developer ascertain the error points and resolve them immediately.
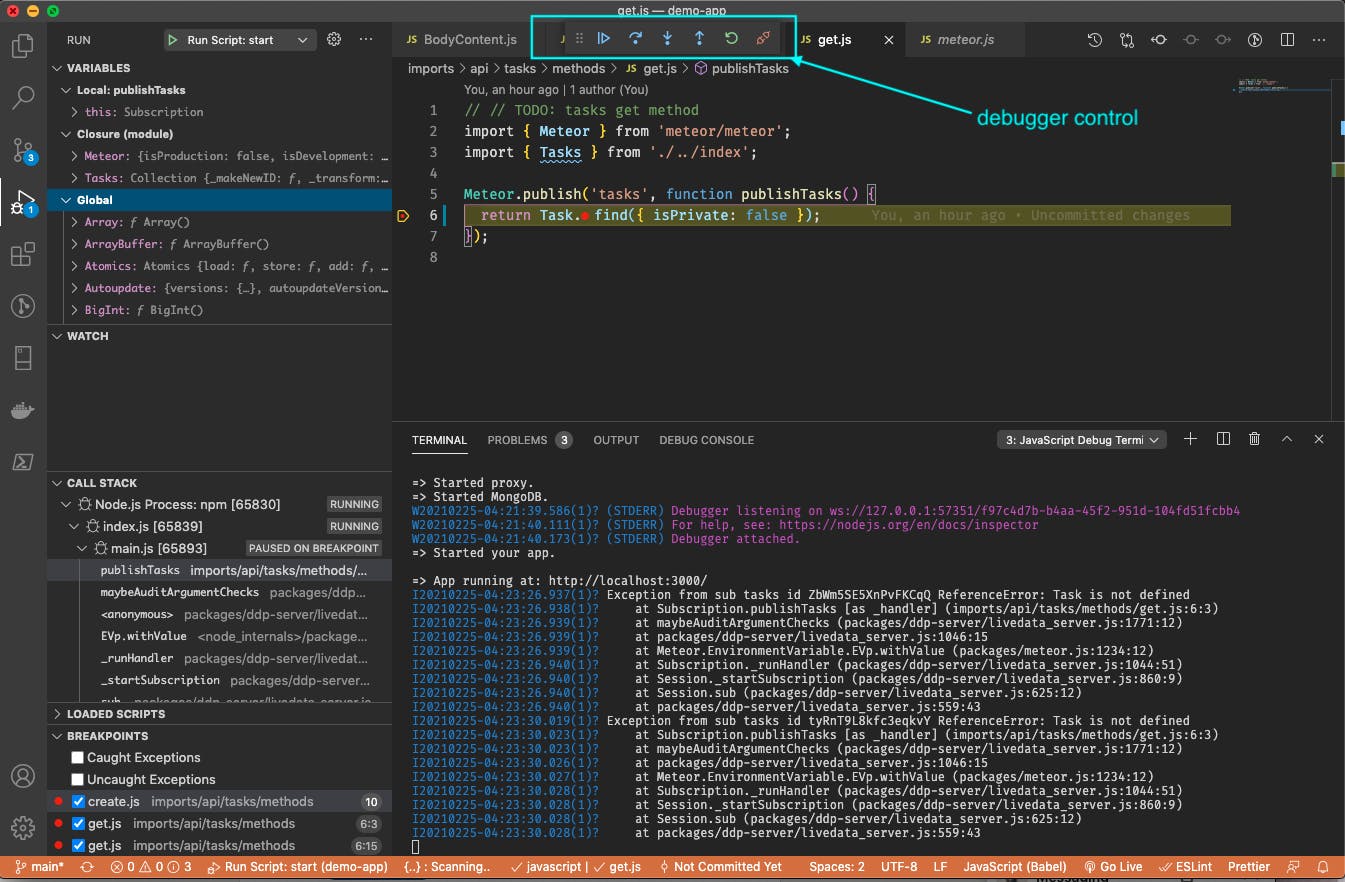
For our case in this demo app, simply changing Task to Tasks solves the issue, as indeed, Task is not defined, the value imported has as, and this was the reason for the ReferenceError encountered.
Note that the bug you may face while coding may not be as obvious as this, but rest assured, using the two steps highlighted in this post, will bring you to the pain point in time.
If you have used other techniques in the past, kindly share them in the comments section, and let's learn together. 😊
Give a reaction 👍🏾 if you found this post useful.